Media Contact:
Emily Pickren
epickren@frac.org
202-640-1118
 Continued investment necessary in federal nutrition programs to reduce hunger and poverty.
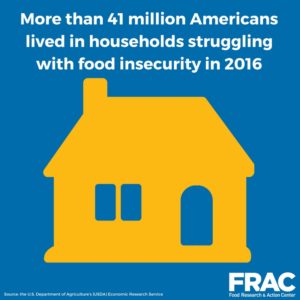
WASHINGTON, September 6, 2017 — More than 41 million Americans lived in households struggling with food insecurity — limited or uncertain access to enough food — in 2016, according to a report released today by the U.S. Department of Agriculture’s (USDA) Economic Research Service. The data reveal a small and not statistically significant decline in household food insecurity in 2016 from the previous year, with the rate dropping from 12.7 to 12.3 percent.
The 12.3 percent household food insecurity rate is still higher than the rate right before the Great Recession (11.1 percent in 2007), and considerably higher than the low point of 10.1 percent in 1999. Indeed, 10 million more people lived in food-insecure households in 2016 than in 1999, and 5 million more than in 2007.
“While there has been progress since the peak of food insecurity driven by the recession — 14.9 percent in 2011 — it is much too little and much too slow,” said Jim Weill, president, Food Research & Action Center (FRAC).
Study after study show that food insecurity harms health, the ability to learn, productivity, and the nation’s economic strength.
The nation’s largest federal nutrition programs, the Supplemental Nutrition Assistance Program (SNAP, formerly known as food stamps) and school meals, serve as the first line of defense against food insecurity for tens of millions of Americans. Both the president’s fiscal year (FY) 2018 budget and the House Budget Committee’s FY 2018 budget resolution propose dramatic cuts to SNAP and school meals.
“The federal government should be leading the way in addressing the fundamental problem of households struggling with hunger, but Congress and the president seem headed in the wrong direction,” said Weill. “SNAP and school meals have a proven track record in effectively addressing food insecurity. Without question, cuts to these programs would make food insecurity in this country far worse.”
Other key findings from the USDA report include:
- The rates of food insecurity were substantially higher than the national average for households with children, and for black- and Hispanic-headed households.
- The food insecurity rate worsened for black, non-Hispanic households from 2015 to 2016, while improving for Hispanic and white, non-Hispanic households.
- Rates among households with children remain higher than rates for households without children (16.5 percent versus 10.5 percent).
- Households in rural areas are experiencing considerably deeper struggles with hunger compared to those in metro areas, with higher rates of food insecurity overall (15 percent compared to 11.8 percent), and higher rates of very low food security (6.6 percent compared to 4.6 percent).
- The food insecurity rate in the South census region, already higher than in the West, Northeast, and Midwest, rose from 2015 to 2016, while the rate in the other three regions fell.
- The prevalence of food insecurity varied considerably by state, ranging from 8.7 percent in Hawaii to 18.7 percent in Mississippi (for the three-year period of 2014–2016).
- Of the 10 most populous states, five had food insecurity rates higher than the national average of 13 percent from 2014–2016: North Carolina (15.1 percent), Ohio (14.8 percent), Michigan (14.3 percent), Texas (14.3 percent), and Georgia (14 percent).
# # #
The Food Research & Action Center is the leading national nonprofit organization working to eradicate poverty-related hunger and undernutrition in the United States. Read FRAC’s A Plan of Action to End Hunger in America.
About the USDA Report
The U.S. Department of Agriculture, using data from surveys conducted annually by the Census Bureau, has released estimates since 1995 of the number of people in households that are food insecure. Food-insecure households are those that are not able to afford an adequate diet at all times in the past 12 months. The report also includes food insecurity rates for each state, but for states, it uses three-year averages to give a better estimate of the number of households experiencing food insecurity.