Overview
Last updated: March 21, 2024
Food insufficiency, which means sometimes or often not having enough to eat, has increased during the COVID-19 pandemic. Certain populations are experiencing higher levels of food insufficiency as a result of systemic inequalities that pre-date the pandemic.
FRAC’s Food Insufficiency During COVID-19 Dashboard includes
- Summary Points
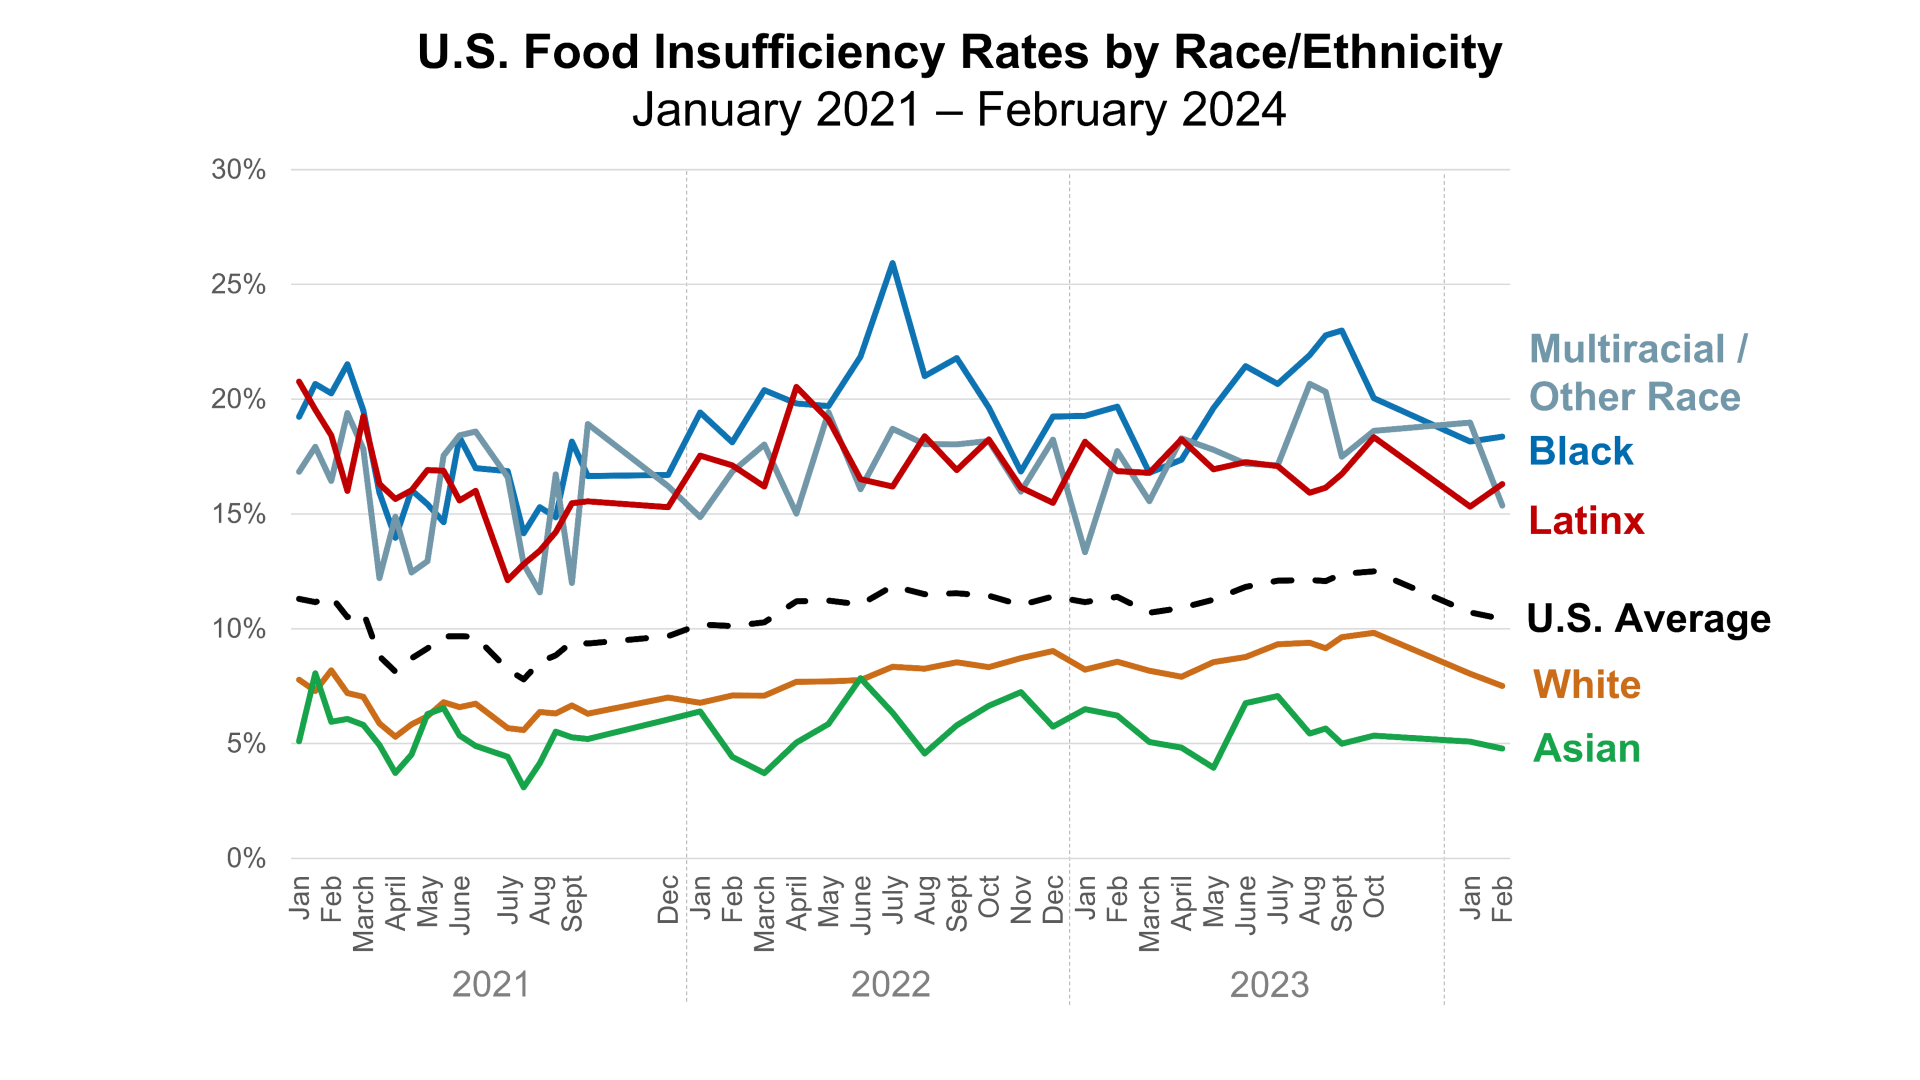
- According to data from the Census Household Pulse Survey data, the rate of food insufficiency (“sometimes” or “often” not having enough to eat) in February 2024 (10.4%) was slightly lower than January 2024 (10.7%).
Context from 2021 to 2023: Food insufficiency increased from August 2021 (when it was at a pandemic-low of 7.8%) to July 2022 (11.9%). From July 2022 through February 2023, rates fluctuated between 11.0-11.5%. After a slight decrease in March and April, rates increased to a high of 12.5% in October 2023.
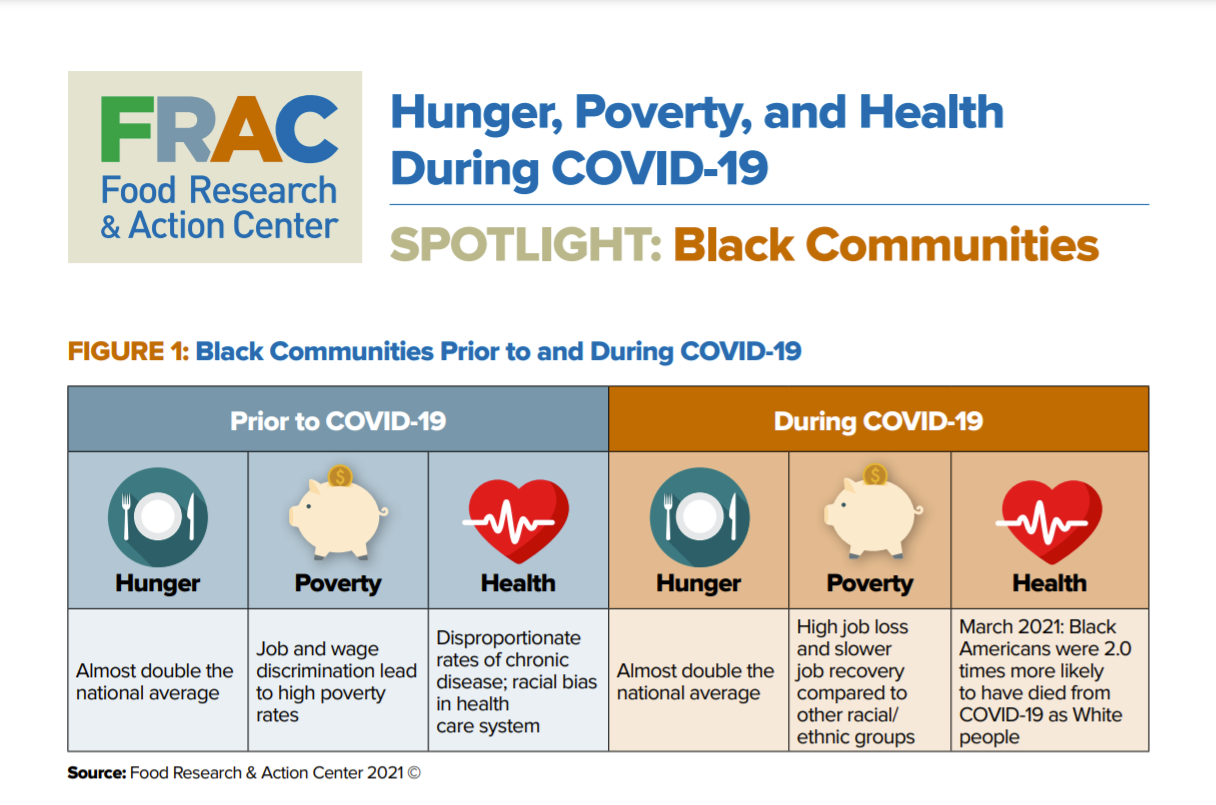
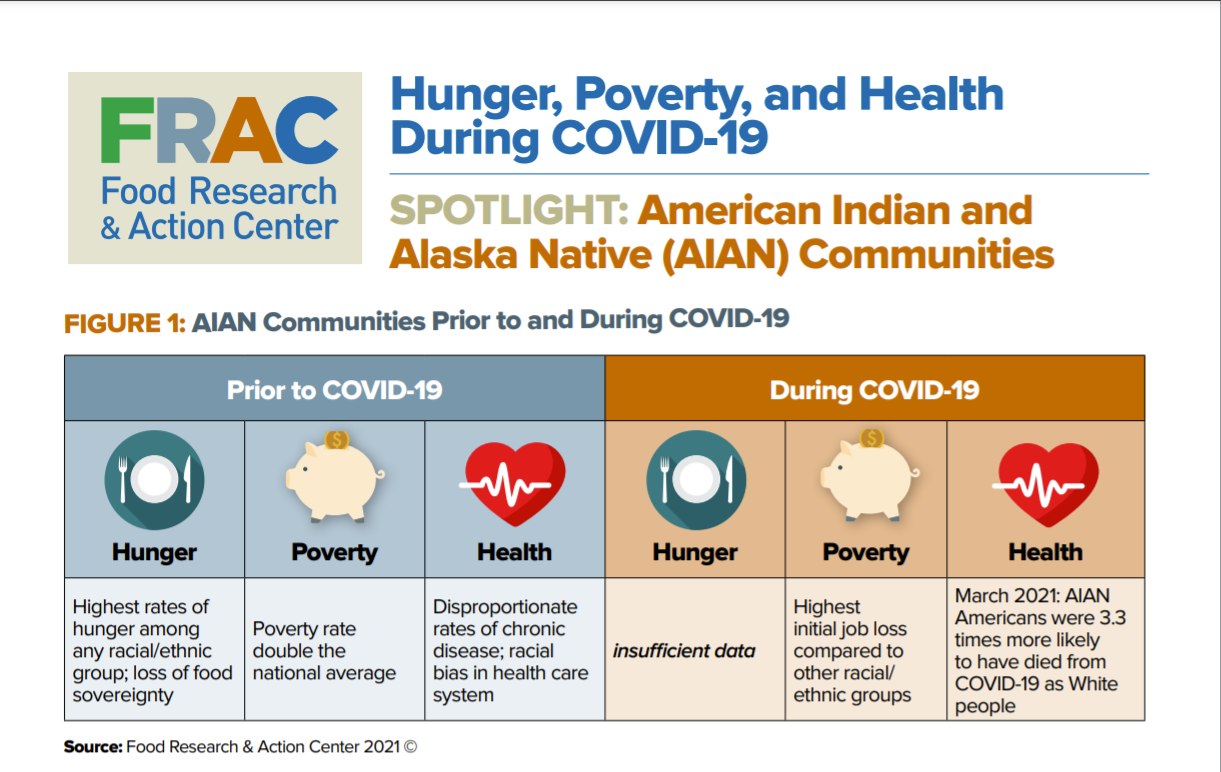
- Breakdown by race/ethnicity: Over the last month, food insufficiency rates slightly increased for Black adults (18.4% in February compared to 18.2% in January) and for Latinx adults (16.3% in February compared to 15.3% in January). Rates of food insufficiency continue to be over twice as high for Black and Latinx adults compared to White adults (7.5% in February).
Higher rates of food insufficiency in Black and Latinx communities are due to systemic racism that results in higher levels of poverty, disinvestment in access to healthy foods or quality education, wage discrimination, and other root causes of hunger.
- Breakdown by family type: Food insufficiency rates among households with children slightly increased (13.5% in February compared to 13.2% in January).
- Breakdown by gender and sexual orientation: In February, 11.2% of women reported food insufficiency compared to 9.6% of men. This disparity has persisted since 2022.
Food insufficiency rates are higher for transgender individuals (16.5%, compared to about 9.5% of cisgender respondents). Overall, food insufficiency rates were 12.3% among those who identified as LGBT, 9.1% among those who did not identify as LGBT, and 18.3% among those who identified as another sexual orientation (e.g., intersex, asexual).
A limitation of these data is the small sample size with each data release, which results in estimates that fluctuate frequently. However, the data consistently show disparities for respondents identifying as transgender or LGBT. Reasons include discrimination that lead to fewer employment opportunities and higher levels of poverty.
- Context to Explain Persistently High Food Insufficiency
- Economic Context: For the most part, the rate of inflation has normalized. However, it is important to remember that since January 2020, the cost of food from the grocery store has risen a total of about 24% percent. The U.S. Department of Agriculture (USDA) noted that grocery store food prices increased by 11.4% in 2022 and 5.0% in 2023. USDA expects grocery store food prices to increase in 2024 by 1.6% over the course of the year.
Of the respondents in the Pulse survey who reported food insufficiency in February 2024, 84.9% indicated that it was because they “couldn’t afford to buy more food.”
In addition, 36.2% of respondents reported finding it “somewhat” or “very” difficult to pay for usual household expenses in February.
- Economic Context: For the most part, the rate of inflation has normalized. However, it is important to remember that since January 2020, the cost of food from the grocery store has risen a total of about 24% percent. The U.S. Department of Agriculture (USDA) noted that grocery store food prices increased by 11.4% in 2022 and 5.0% in 2023. USDA expects grocery store food prices to increase in 2024 by 1.6% over the course of the year.
- Key Takeaways
- Despite declines over the past five months, rates of food insufficiency are still substantially higher than they were in 2021.
- Twice as many Black and Latino adults report food insufficiency than white adults due to persistent barriers resulting from structural racism.
- See FRAC’s Action Center for bills we’re supporting and how you can get involved.
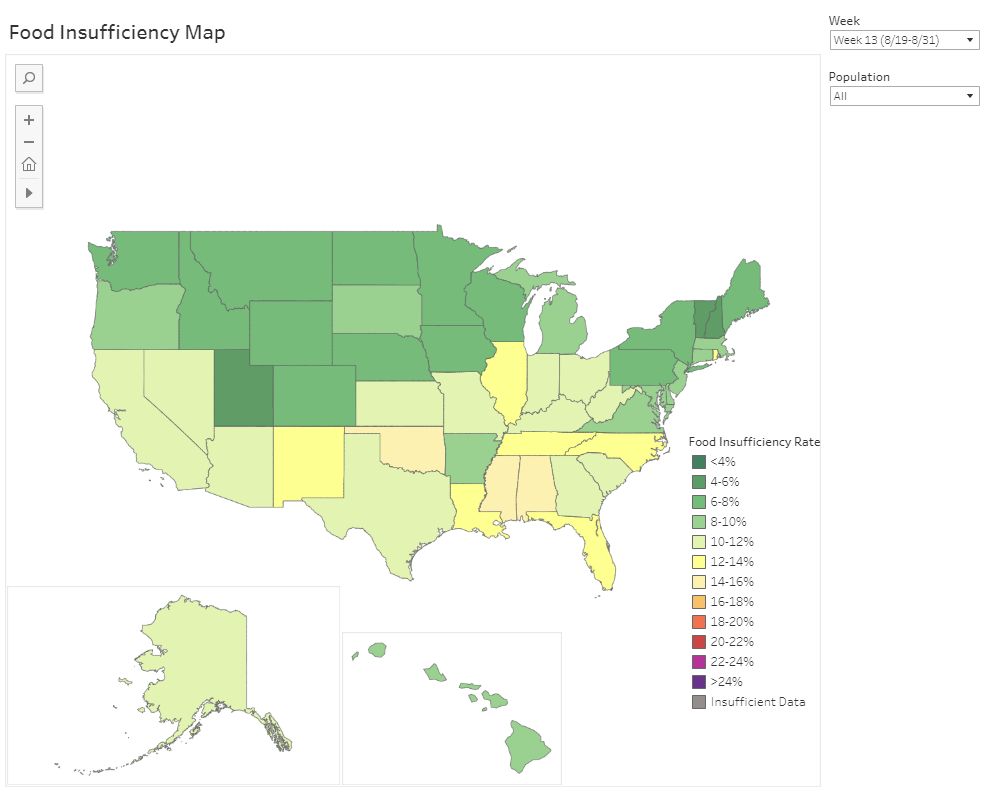
Mapping Food Insufficiency
The map shows the average rate of food insufficiency, which means sometimes or often not having enough to eat, in the previous seven days. Food insufficiency rates are calculated from the Census Household Pulse Survey data.
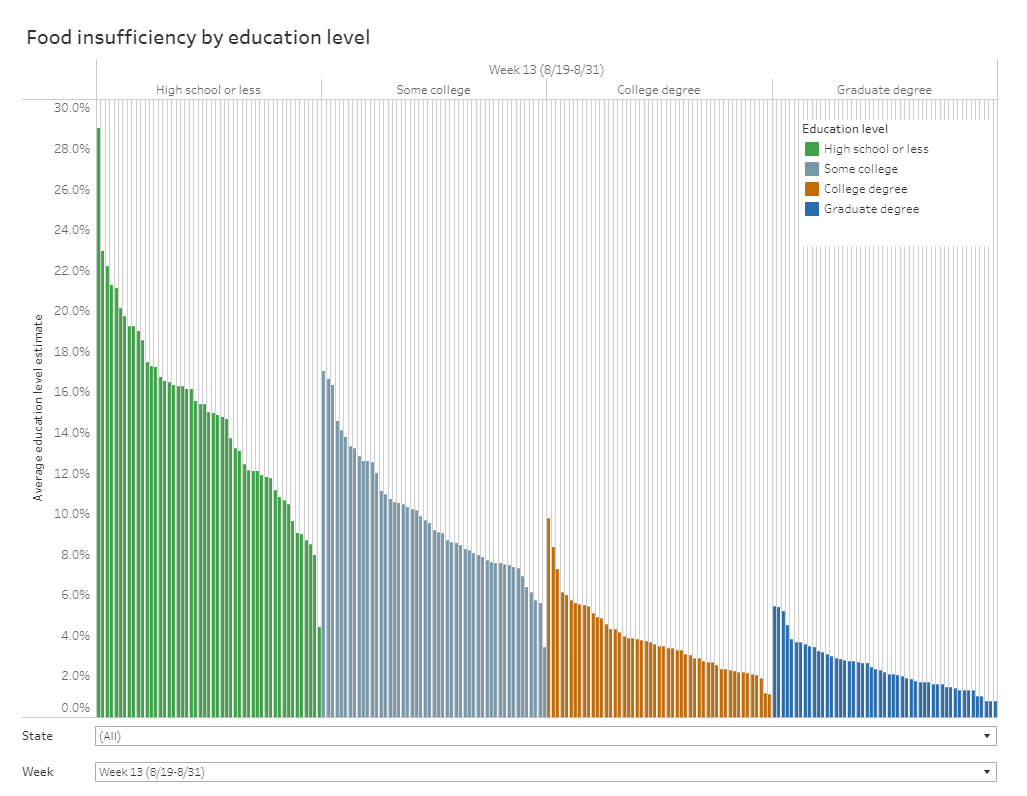
Comparing States
The bar graphs show the average rate of food insufficiency, which means sometimes or often not having enough to eat, in the previous seven days. Food insufficiency rates are calculated from the Census Household Pulse Survey data.
Impact of COVID-19 on Special Populations

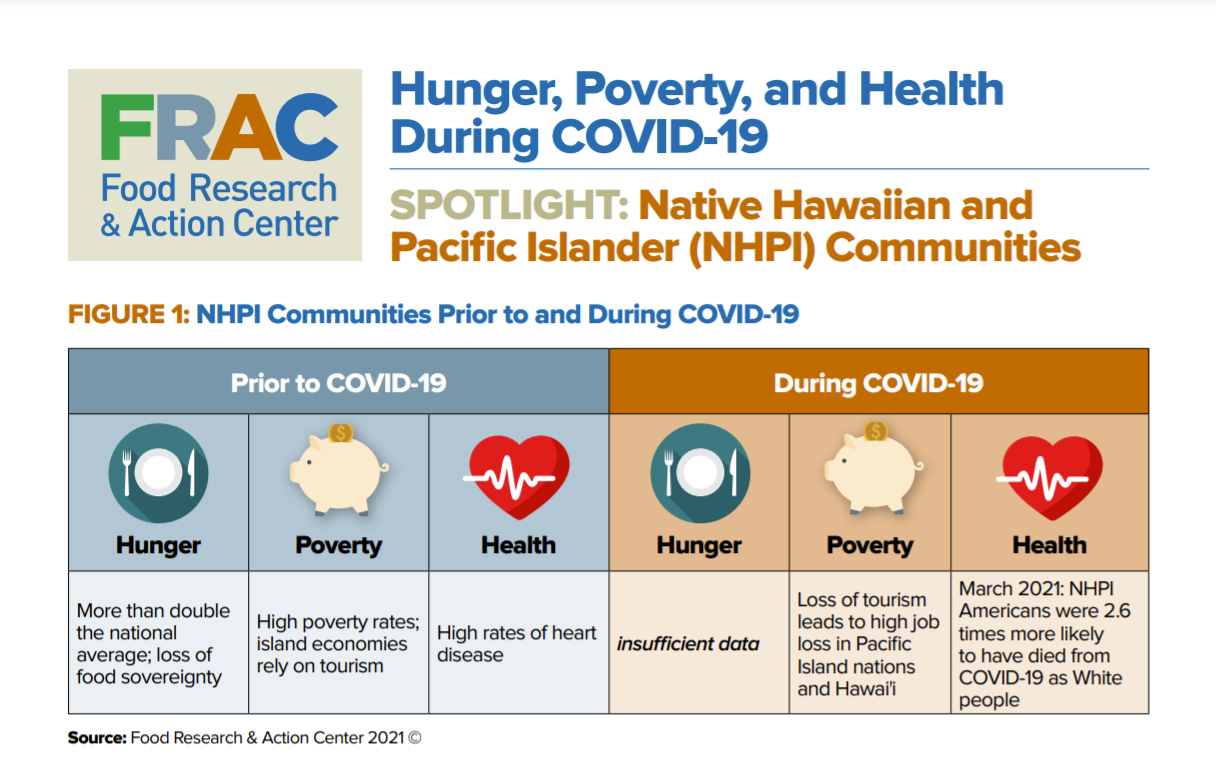
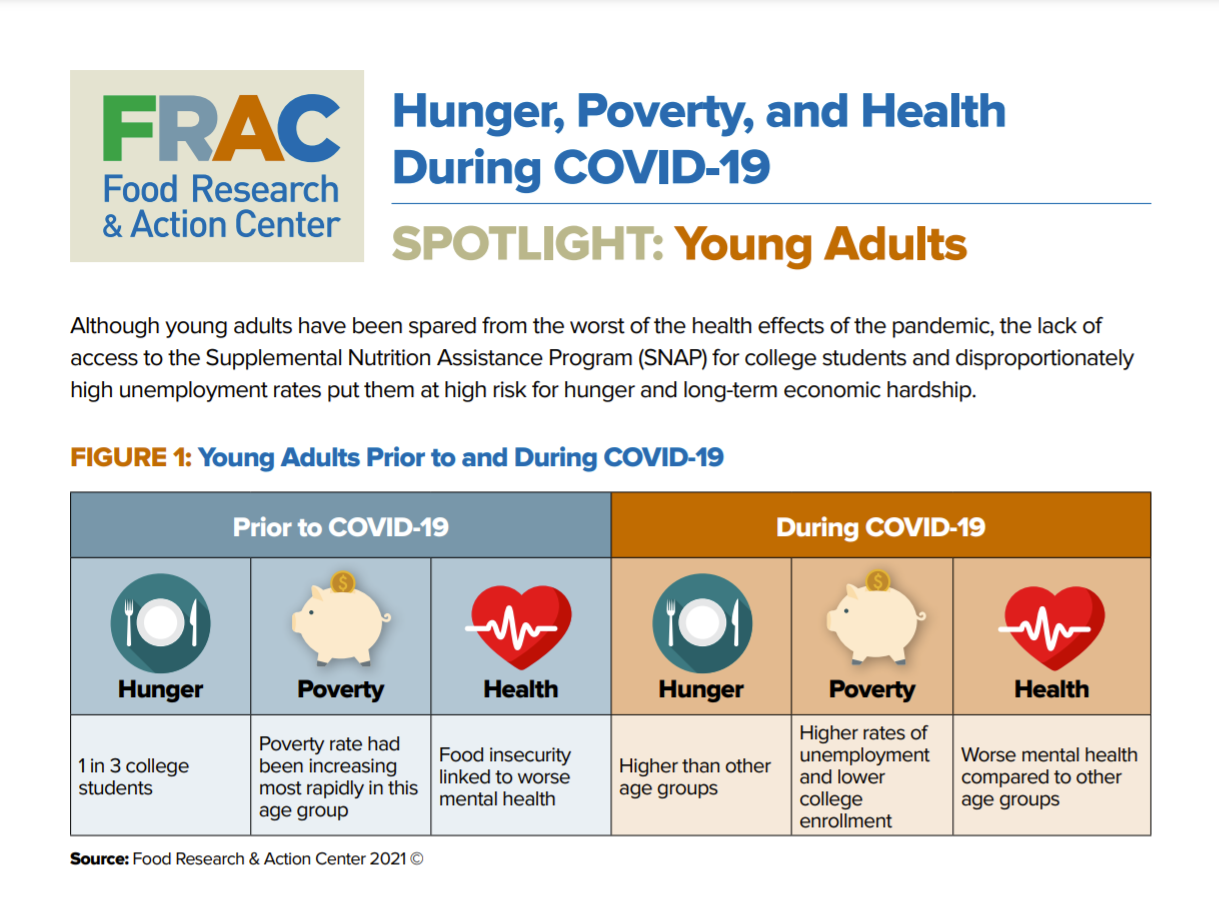

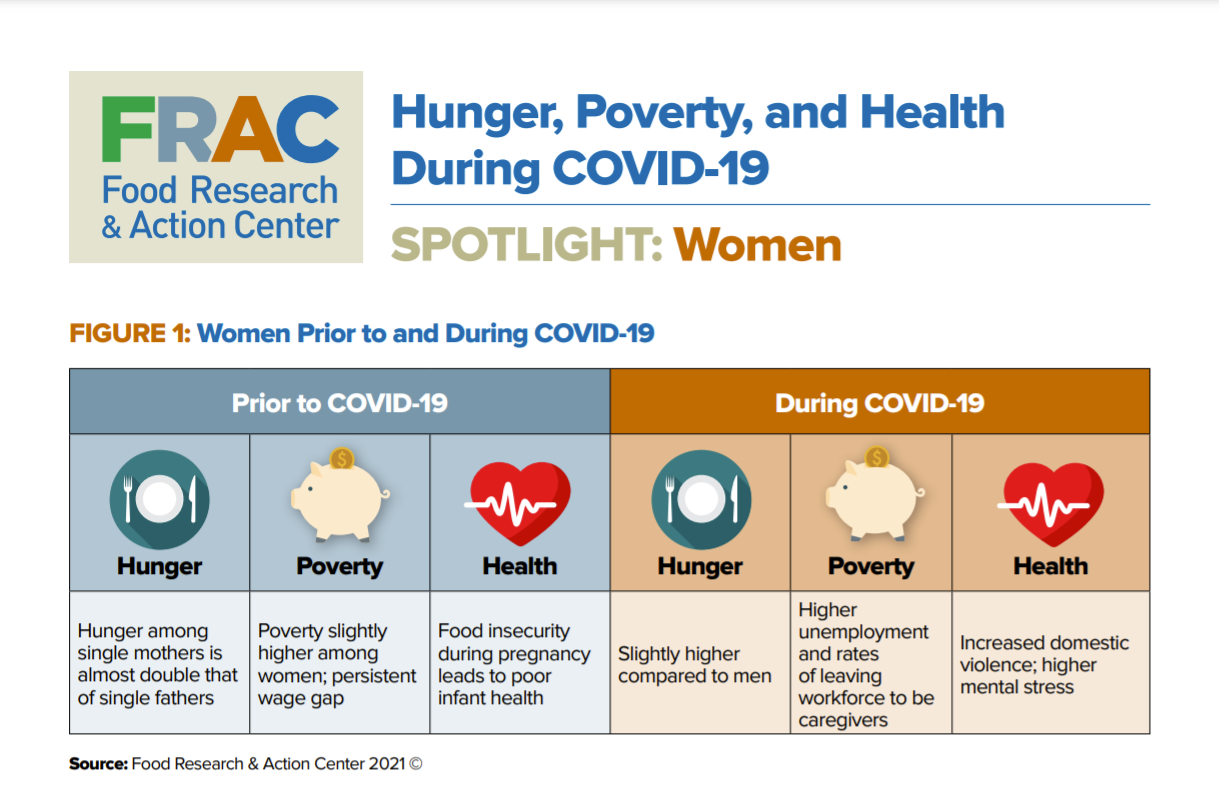
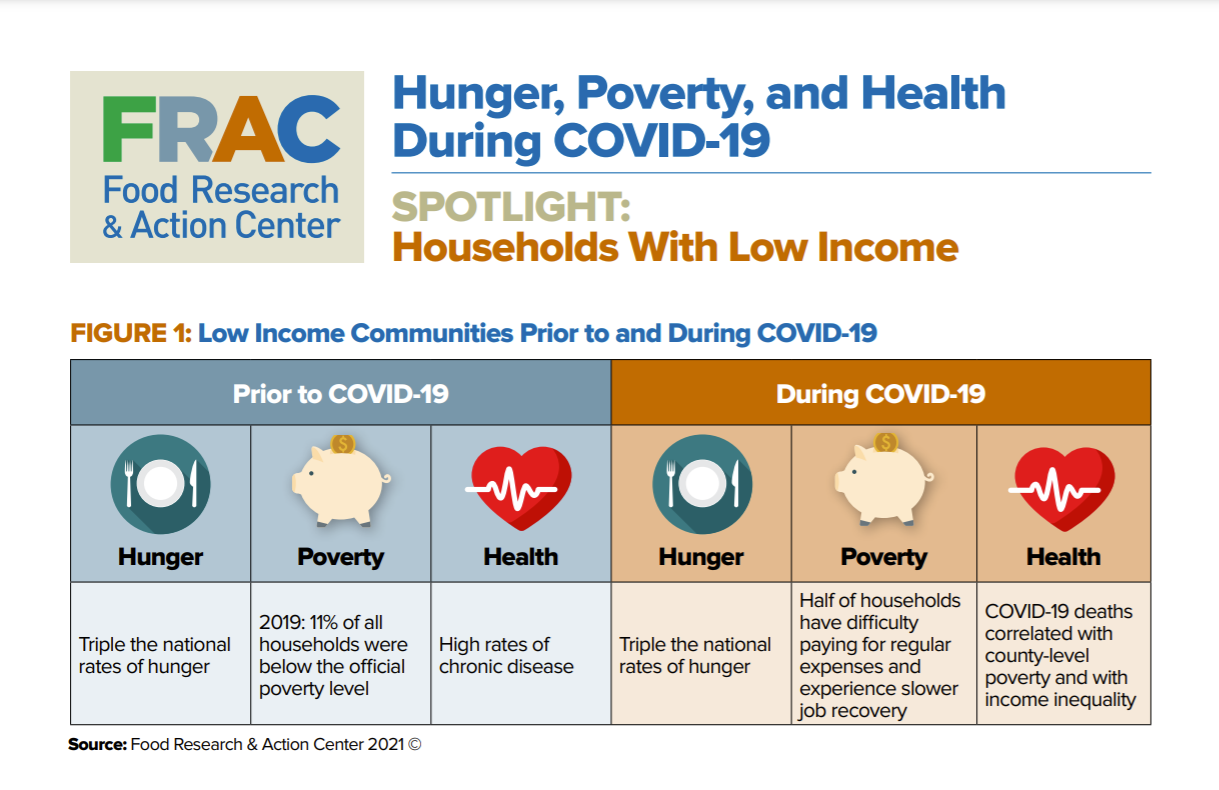

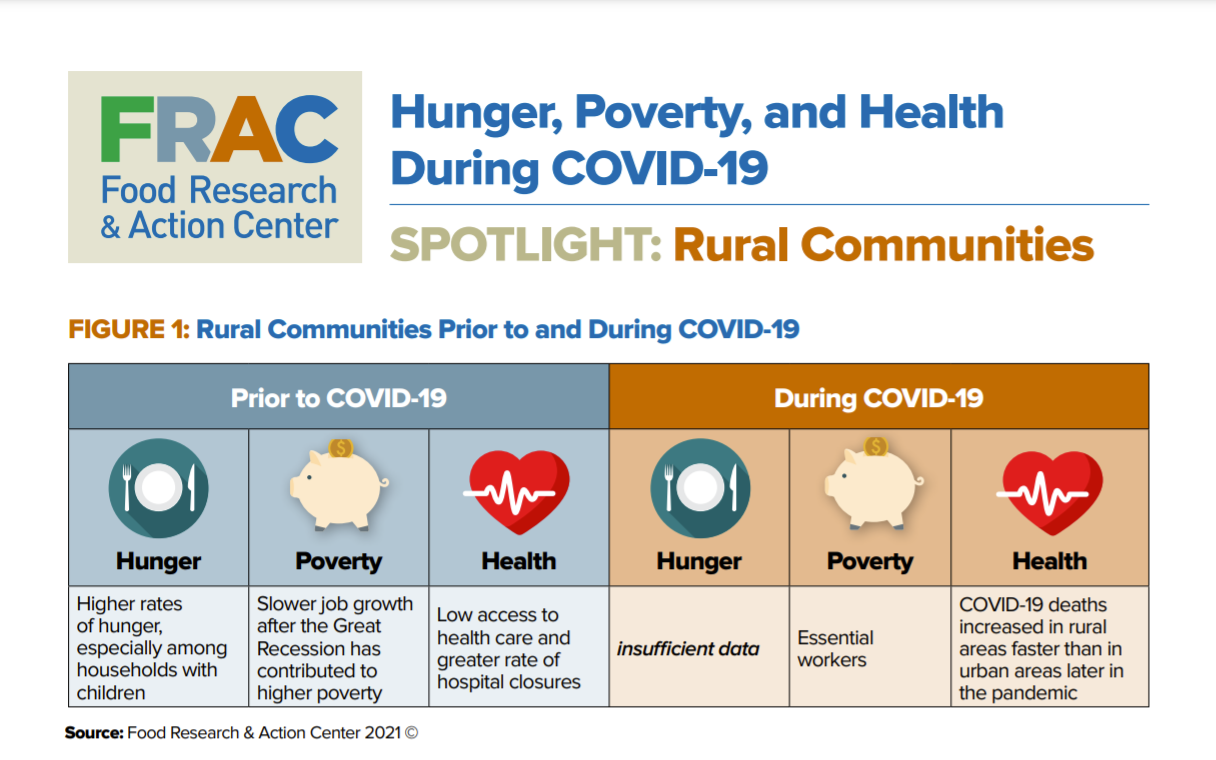

Hunger, Poverty, and Health Disparities During COVID-19 and the Federal Nutrition Programs’ Role in an Equitable Recovery
The health and economic crises brought on by the COVID-19 pandemic has made the federal nutrition programs more important than ever. FRAC’s latest report is a review of new research on how the federal nutrition programs reduce hunger, poverty, and health, including their efficacy during the pandemic, and concludes with policy recommendations to leverage the federal nutrition programs for a robust and equitable recovery.