Latest Map – Poverty Rates by State
This interactive map provides data for every state on the percent of all people living in poverty, based on the American Community Survey (ACS).
Explore FRAC's SNAP, Food Insecurity and Poverty Maps:
- Interactive State Map: Share of Older Adult (60+) Households Participating in SNAPThis interactive map produced in collaboration with the AARP Foundation, shows the share of all households with older adults (age 60+) in each state that participate in the Supplemental Nutrition Assistance Program (SNAP) at the state, metropolitan, small town, and rural levels.
- SNAP Matters to Older Adults in Every Community—Metro, Small Town, and Rural AreasThis interactive map produced in collaboration with the AARP Foundation, shows the share of all households with older adults (60+) that participate in SNAP in each county.
- SNAP Households by Congressional DistrictThis interactive map provides data for every congressional district on the share of all households that were participating in SNAP, based on the American Community Survey (ACS).
- Poverty Rates by Congressional DistrictThis interactive map provides data for every congressional district on the percent of all people living in poverty, based on the American Community Survey (ACS).
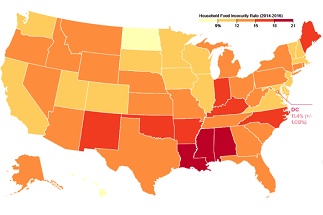
- Map: Household Food Insecurity RatesThis interactive map shows household food insecurity rates, by state. Scrolling over a state reveals the percent of households struggling with food insecurity or very low food security.
- SNAP Map: SNAP Matters in Every StateThis interactive mapping tool provides household participation rates for the Supplemental Nutrition Assistance Program (SNAP, formerly known as food stamps) by state.
- SNAP Map: SNAP Matters in Every CommunityThis interactive mapping tool provides household participation rates for the Supplemental Nutrition Assistance Program (SNAP, formerly known as food stamps), by county in each state. Each county is grouped into one of three census categories: Metro, Small Town, and Rural.
- Households with Seniors Facing Food InsecurityThis interactive map provides food insecurity rates among households with seniors age 60+, by state.