Published April 2, 2026
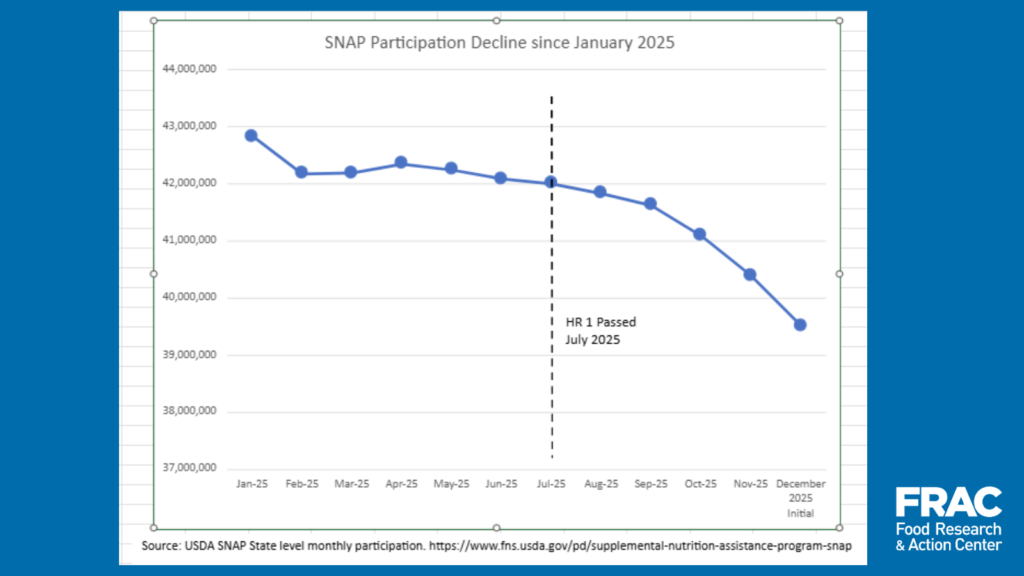
Over the past year, SNAP participation has declined by approximately 3.3 million people. This is neither a neutral correction nor evidence that fewer Americans need help affording food. It is the predictable outcome of a set of deliberate policy choices advanced by the Trump administration and a majority of Republicans in Congress — choices that systematically reduce access to the program, increase administrative burden, and shift responsibility away from the federal government and onto states, localities, and ultimately families themselves.
SNAP provided food assistance to 42 million Americans in July 2025, and 39.5 million in December, and the program’s composition makes clear what is at stake when participation declines. Nearly 40 percent of SNAP participants are children, 20 percent are older adults, and 10 percent are individuals with disabilities. Nearly three-quarters of SNAP households have gross monthly incomes at or below the federal poverty line — $33,000 annually for a family of four. These are families and individuals already living with deep economic constraints, for whom food assistance is a stabilizing necessity.
When fewer people can access food assistance, especially amid rising costs and economic instability, the result is not efficiency; it is increased hunger.
A Pattern the Country Has Seen Before
To understand what is happening now, it is instructive to look backward. The United States has seen this pattern before. In the early 1980s, under the Reagan administration, federal policy tightened eligibility, reduced benefit adequacy, and imposed additional administrative barriers on what was then called the Food Stamp Program. These changes occurred during a period of rising unemployment and poverty. Clinicians, mayors, and advocates were left documenting the outcomes — families skipping meals, children experiencing developmental harm, and older adults facing worsening health conditions. The lesson from that period is clear: When policymakers restrict access to nutrition assistance while economic pressures persist, food insecurity rises.
Dismantling Access and Undermining Trust
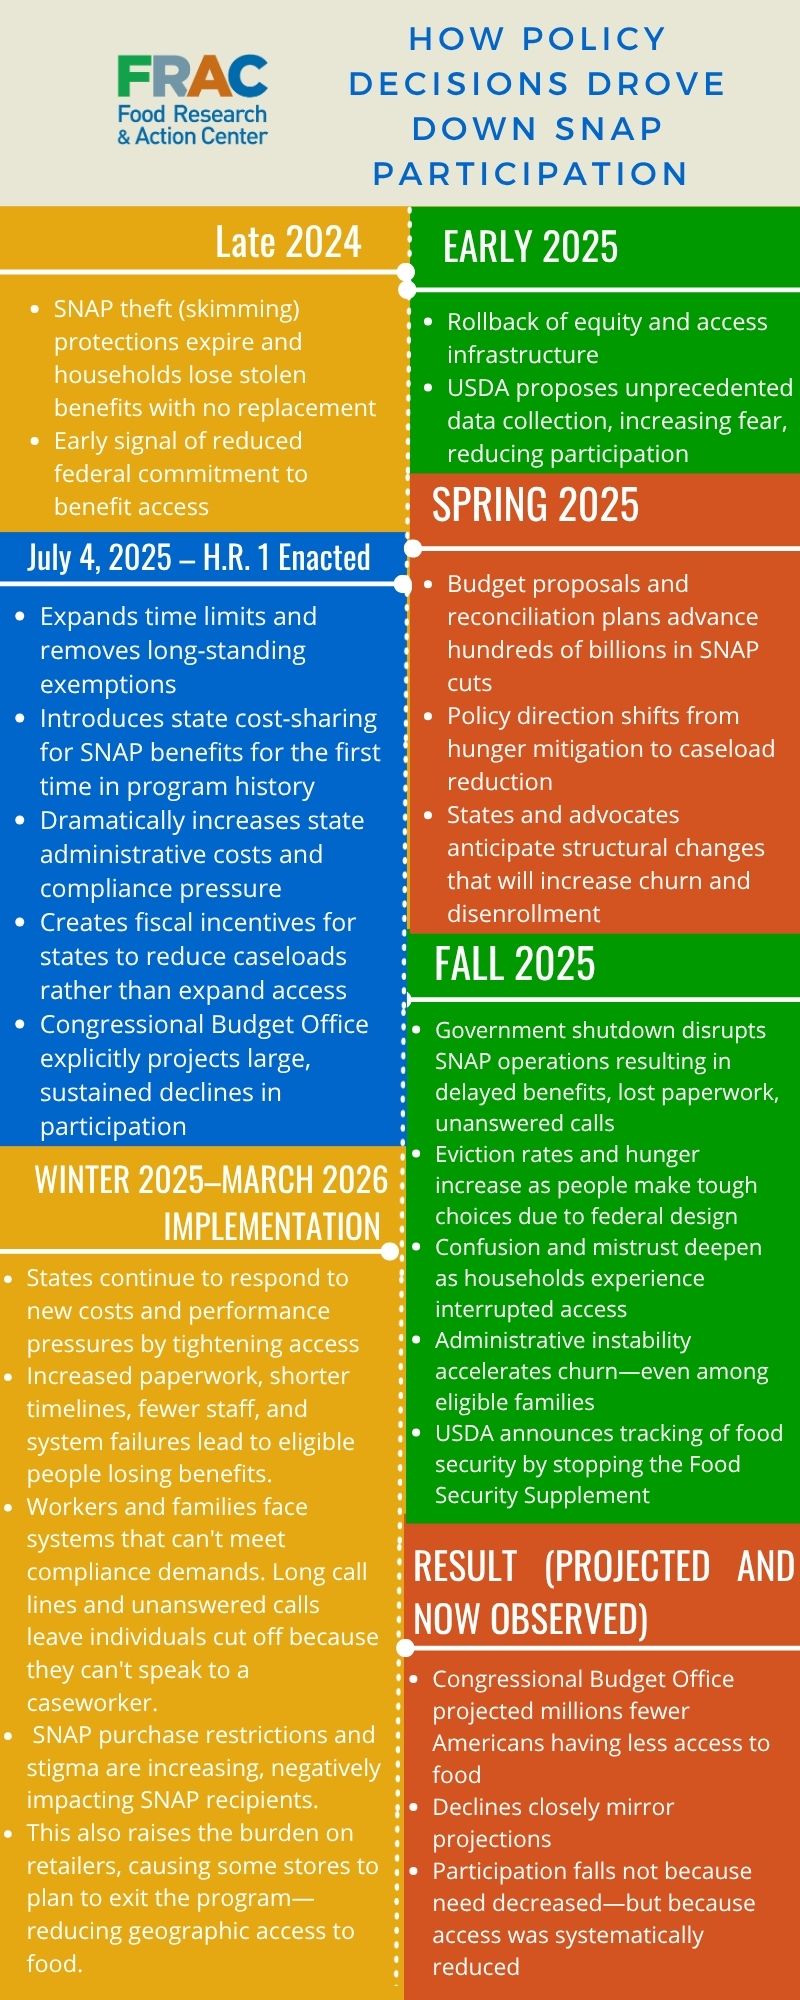
The decline in SNAP participation that we are seeing now did not begin with the passage of the budget reconciliation law, H.R. 1. It began earlier, with a clear signal of priorities. At the end of 2024, the federal funding to replace benefits for victims of SNAP benefit theft was allowed to expire, due to President Trump’s intervention before taking office. The consequence was immediate: Households had their benefits stolen that were no longer made whole, and SNAP participants knew that the federal government no longer had their back. This established a pattern that would continue — reducing participation not by reducing need, but by increasing loss, friction, and instability.
From there, the administration moved to dismantle key access infrastructure. The rollback of equity-focused administrative improvements — tools that had reduced barriers, expanded language access, and improved cross-enrollment systems. These changes disproportionately affected communities already facing higher rates of food insecurity, including communities of color, immigrant households, and rural populations. Participation began to decline not because households were better off, but because the system was harder to navigate.
At the same time, the administration introduced an unprecedented expansion of federal data collection demands on SNAP participants. The U.S. Department of Agriculture sought to require states to turn over extensive personally identifiable information, including Social Security numbers, home addresses, immigration-related data, and up to five years of participation history — not only for current participants but also for individuals who had applied and never received benefits. In over six decades of SNAP’s federal-state partnership, such sweeping data collection had never been required. Historically, federal oversight relied on anonymized or limited datasets to protect participant privacy and maintain trust in the program. This shift raised immediate legal concerns and, more importantly, created a chilling effect. Participation declined further, not because need diminished, but because trust eroded.
H.R. 1: A Structural Overhaul That Drives Caseload Reduction
The passage of the budget reconciliation law, H.R. 1, on July 4, 2025, marked a turning point from erosion to structural redesign, with the intention of removing people from the program. The Congressional Budget Office (CBO) explicitly stated to policymakers that the provisions in H.R. 1 would reduce participation by approximately 2.4 million people in an average month over the 2025–2034 period. That estimate closely mirrors the decline now being observed.
CBO further detailed who would be affected: roughly 800,000 would be adults up to age 64 without dependent children; 300,000 would be adults living with children age 14 or older; and approximately 1 million would be individuals who, under prior law, would have qualified for waivers from time limits. In addition, restrictions on SNAP eligibility for asylees, refugees, and victims of human trafficking under Section 10108 were expected to push approximately 90,000 people off SNAP in an average month. These are the exact populations now losing access.
For the first time in the program’s history, SNAP has shifted away from a federally guaranteed benefit toward a model that intentionally introduces instability. By requiring states to begin paying for a part of benefits and dramatically increasing their share of administrative costs, the law created strong fiscal incentives for states to reduce caseloads. SNAP has never functioned as a capped, discretionary line item; it has historically expanded to meet need. This structural change reverses that principle, placing states in the position of managing scarcity.
Since the enactment of H.R. 1, the impacts have deepened precisely as analysts predicted. States, facing new and unprecedented financial obligations, are responding by tightening access. To save money and meet federal performance thresholds tied to error rates and timelines, they are increasing documentation requirements, shortening response windows, and adding procedural hurdles. At the same time, eligibility systems are strained. Staff capacity at SNAP agencies is not theoretical; it is a daily operational constraint. Phones go unanswered. Individuals trying to report changes or comply with requirements cannot get through. When compliance depends on interaction with a system that is not functioning, eligible people lose benefits.
This is not accidental. People are being cut off not because they no longer qualify, but because the system is designed in a way that makes maintaining eligibility increasingly difficult. As households experience delays, confusion, and failed attempts to access assistance — especially following the disruption during the 2025 government shutdown — trust in the program will deteriorate. Participation will decline further as people disengage from a system they no longer believe will work for them.
At the same time, additional policy choices are reinforcing this contraction. The push for SNAP purchase restrictions, framed as health interventions, adds stigma at the point of sale and imposes costly compliance burdens on retailers. Smaller grocers, particularly in rural communities, face new technology and labor requirements that many cannot absorb. As participation declines and compliance costs rise, some retailers will exit the program altogether. The result is reduced access not only through eligibility, but through the physical disappearance of places where SNAP can be used.
Table 1 shows the difference SNAP participation between January and December 2025. All but three states had a decrease in SNAP participants over the year, with Arizona experiencing the largest drop.
| State / Territory | Jan. '25 | Dec. '25 (Initial) | Change | % Decline, January to December |
|---|---|---|---|---|
| Alabama | 742,614 | 702,907 | -39,707 | 5% |
| Alaska | 62,916 | 64,774 | 1,858 | |
| Arizona | 898,476 | 598,852 | -299,624 | 33% |
| Arkansas | 239,627 | 229,989 | -9,638 | 4% |
| California | 5,496,920 | 5,231,005 | -265,915 | 5% |
| Colorado | 620,478 | 590,753 | -29,725 | 5% |
| Connecticut | 377,990 | 336,145 | -41,845 | 11% |
| Delaware | 119,497 | 114,221 | -5,276 | 4% |
| District of Columbia | 141,346 | 139,822 | -1,524 | 1% |
| Florida | 3,035,496 | 2,590,727 | -444,769 | 15% |
| Georgia | 1,937,567 | 1,764,661 | -172,906 | 9% |
| Guam | 33,011 | 40,815 | 7,804 | |
| Hawaii | 155,783 | 163,285 | 7,502 | |
| Idaho | 134,855 | 123,859 | -10,996 | 8% |
| Illinois | 1,908,007 | 1,783,859 | -124,148 | 7% |
| Indiana | 600,776 | 545,195 | -55,581 | 9% |
| Iowa | 261,142 | 252,435 | -8,707 | 3% |
| Kansas | 187,290 | 176,821 | -10,469 | 6% |
| Kentucky | 582,803 | 576,711 | -6,092 | 1% |
| Louisiana | 825,467 | 750,066 | -75,401 | 9% |
| Maine | 171,238 | 156,230 | -15,008 | 9% |
| Maryland | 680,346 | 651,955 | -28,391 | 4% |
| Massachusetts | 1,098,366 | 996,053 | -102,313 | 9% |
| Michigan | 1,508,947 | 1,432,166 | -76,781 | 5% |
| Minnesota | 451,151 | 438,646 | -12,505 | 3% |
| Mississippi | 369,036 | 334,391 | -34,645 | 9% |
| Missouri | 659,962 | 632,439 | -27,523 | 4% |
| Montana | 80,591 | 73,142 | -7,449 | 9% |
| Nebraska | 151,994 | 138,013 | -13,981 | 9% |
| Nevada | 503,643 | 433,142 | -70,501 | 14% |
| New Hampshire | 76,174 | 75,010 | -1,164 | 2% |
| New Jersey | 830,058 | 797,548 | -32,510 | 4% |
| New Mexico | 471,266 | 446,184 | -25,082 | 5% |
| New York | 2,974,909 | 2,839,867 | -135,042 | 5% |
| North Carolina | 1,504,348 | 1,294,856 | -209,492 | 14% |
| North Dakota | 55,532 | 53,167 | -2,365 | 4% |
| Ohio | 1,444,052 | 1,376,454 | -67,598 | 5% |
| Oklahoma | 701,611 | 629,337 | -72,274 | 10% |
| Oregon | 774,581 | 734,022 | -40,559 | 5% |
| Pennsylvania | 1,984,515 | 1,829,208 | -155,307 | 8% |
| Rhode Island | 146,390 | 130,564 | -15,826 | 11% |
| South Carolina | 569,075 | 522,178 | -46,897 | 8% |
| South Dakota | 75,412 | 70,961 | -4,451 | 6% |
| Tennessee | 695,903 | 629,537 | -66,366 | 10% |
| Texas | 3,489,634 | 3,244,886 | -244,748 | 7% |
| Utah | 178,282 | 159,978 | -18,304 | 10% |
| Vermont | 65,808 | 61,409 | -4,399 | 7% |
| Virginia | 822,941 | 721,486 | -101,455 | 12% |
| Virgin Islands | 21,590 | 19,525 | -2,065 | 10% |
| Washington | 906,403 | 872,422 | -33,981 | 4% |
| West Virginia | 273,926 | 255,901 | -18,025 | 7% |
| Wisconsin | 700,370 | 660,654 | -39,716 | 6% |
| Wyoming | 28,334 | 24,800 | -3,534 | 12% |
| National Total | 42,828,449 | 39,513,033 | -3,315,416 | 8% |
Public Health and Economic Consequences
The consequences extend far beyond individual households. SNAP is one of the most effective public health interventions in the U.S. Research consistently shows that it reduces food insecurity, improves child development, lowers health care costs, and lifts people out of poverty. When benefits are reduced or terminated, families are more likely to experience food insecurity, caregivers report worse health outcomes, and children face increased developmental risks. These effects carry long-term consequences for educational attainment, workforce participation, and overall economic productivity.
SNAP also contributes to local and regional economies. Every dollar in benefits generates up to $1.80 in economic activity during downturns. When participation declines, that activity disappears — reducing revenue for grocers and farmers. Reducing federal spending on SNAP shifts the costs to other entities. States, cities, food banks, and health systems absorb the consequences. Increased hunger leads to higher demand for emergency food assistance, greater strain on local budgets, and increased health care expenditures. And charity cannot meet the growing need. For every one meal provided by a food bank, SNAP provides nine.
A Predictable Policy Failure With Real Human and Economic Costs
It is also essential to be clear about who benefits from this policy direction. The contraction of SNAP is occurring alongside broader fiscal policies that deliver substantial tax advantages to billionaires and large corporations. This is not a coincidence. The same legislative framework that reduces food assistance also redistributes resources upward. The result is a policy structure in which low-income households lose access to basic needs support while wealth accumulates at the top.
Kicking people off SNAP is not an indicator of success; it’s an indicator of the failure of the wealthiest country on earth, to let its citizens go hungry. It does not reduce the need. It does not improve health. It does not strengthen the economy. It simply shifts harm onto families, onto states, and onto communities that are already stretched thin. The decline in SNAP participation reflects a system that is becoming harder to access, less trusted, and less capable of fulfilling its purpose.
The decline of 3.3 million SNAP participants is not the end of this trajectory. It is the beginning of a broader increase in food insecurity driven by policy design.