
September 14, 2022
Over the last week, the U.S. Department of Agriculture (USDA) and the U.S. Census Bureau have released their respective annual reports on food insecurity and poverty in the United States.
From 2020 to 2021, the national rate of food insecurity, defined as trouble providing enough food for everyone in the household due to lack of resources, fell slightly from 10.5 to 10.2 percent (although the difference was not statistically significant). The Supplemental Poverty Measure (SPM), which accounts for local cost of living, taxes and refunds, and participation in government programs, fell significantly from 9.2 to 7.8 percent.
The fact that rates of food insecurity did not increase in 2020 and 2021 during the pandemic (see Figure 1) is a testament to the magnitude of the federal response to buoy households through unprecedented health and economic hardship. Yet, the plateauing of the rate of food insecurity over the last three years is a disruption in an almost decade-long decline in food insecurity since the Great Recession. Examining food insecurity over this longer period is illustrative of just how disruptive the pandemic has been, and on the flip side, how important a strong nutrition and social safety net is for all Americans.
Figure 1: Rates of Food Insecurity Among Many Types of Households Was on a Decade-Long Decline Prior to the COVID-19 Pandemic
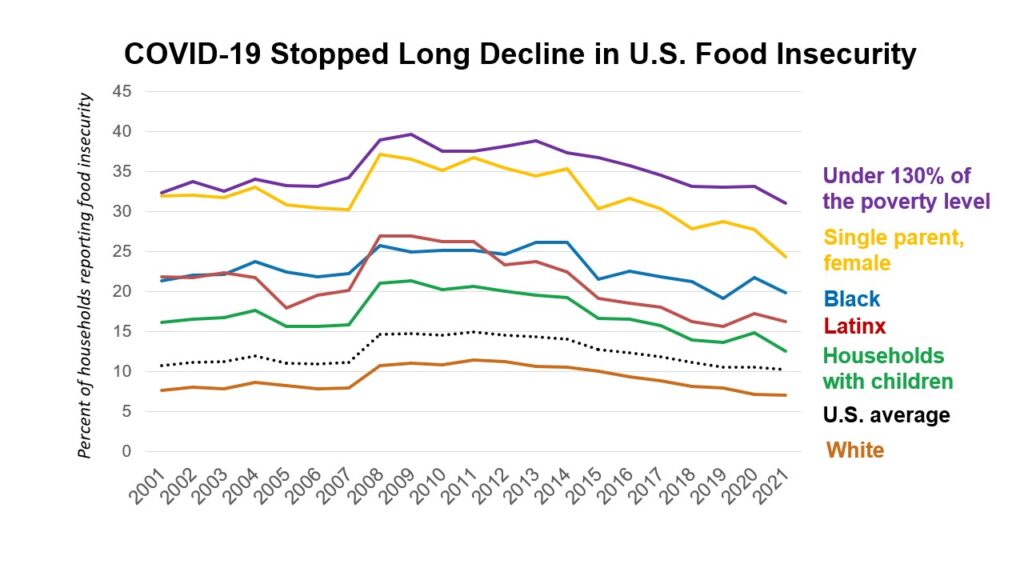
Due to the Great Recession, the prevalence of food insecurity increased from 11.1 percent in 2007 to 14.6 percent in 2008 and reached a high of 14.9 percent in 2011.
Since 2011, food insecurity had been on a slow and steady decline. This was true for virtually every racial and ethnic group and for different types of households, such as households with children. The pandemic disrupted this progress.
Households with children. The biggest changes in food insecurity and poverty have been among households with children, where expansions to federal programs played a key role in mitigating hardship.
- From 2019 to 2020, food insecurity among households with children increased significantly from 13.6 to 14.8 percent. While the SPM child poverty rate fell from 2019 to 2020, the first year of the pandemic was characterized by abrupt school closures and the loss of school meals. Although this quickly gave rise to innovative and effective waivers for school meal distribution and programs like Pandemic EBT (P-EBT), the number of children served by school meals declined in 2020. In addition, adults in households with children were more likely to lose their job early in the pandemic compared to households without children, and reported sometimes not having enough to eat.
- From 2020 to 2021, food insecurity among households with children fell significantly from 14.8 to 12.5 percent. The SPM child poverty rate fell dramatically by 46 percent, from 9.7 percent in 2020 to 5.2 percent in 2021. A number of programs were expanded and proven to reduce hunger:
- Schools used lessons learned from 2020 to expand offering meals to all students as they returned to in-person schooling. The census poverty report reflects the increased reach of school lunch, finding that school lunch lifted more children out of poverty in 2021 compared to 2020.
- Pandemic-EBT was fully implemented and service was expanded to children under 6.
- From July to December 2021, families received the Child Tax Credit (CTC), which was associated with reduced hunger among households with children; the CTC lifted 2.9 million children out of poverty in 2021.
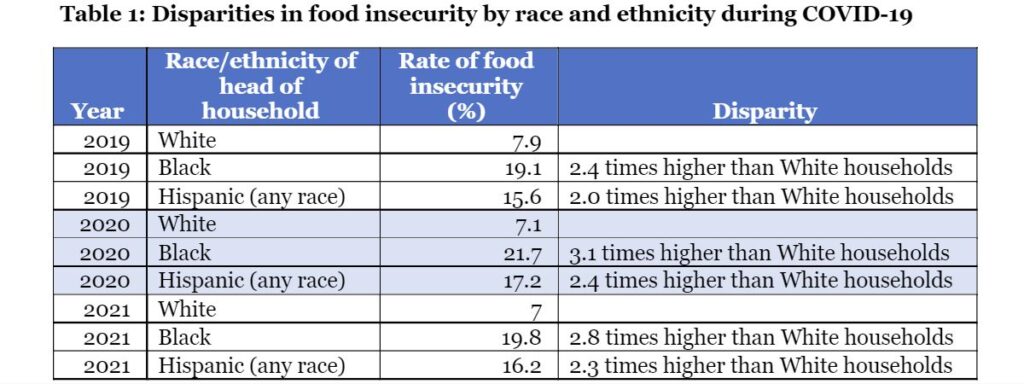
Disparities by race and ethnicity. Racial disparities in food insecurity increased from 2019 to 2020, which was reflective of how COVID-19 exacerbated long-standing structural inequities in income, employment, and health. From 2020 to 2021, these disparities were reduced, although they are still unacceptably high (see Table 1).
In addition to the federal nutrition programs, investments from the American Rescue Plan have made the recovery in employment more equitable than previous recoveries. From 2020 to 2021 SPM poverty rates fell:
- 3 percentage points for Black households (14.7 to 11.3 percent)
- 8 percentage points for Latinx households (14.0 to 11.2 percent)
- 8 decrease for White households (6.5 to 5.7 percent)
Adults living alone. Within groups of adults living alone, there was a rise in food insecurity. Many expanded federal programs in 2021, like the Child Tax Credit, did not reach households with adults living alone.
Rates also rose significantly among women living alone (11.0 to 13.2 percent).
Rates among adults over 65 years old living alone also increased significantly from 2020 to 2021 (from 8.3 to 9.5 percent), rising to their highest rate in 20 years. In addition, adults over 65 were the only group for whom SPM poverty rates increased from 2020 to 2021, from 9.5 to 10.7 percent. A larger share of these older adults are on fixed incomes that have not been keeping pace with inflation.
Policy Implications and Next Steps
Despite overall reductions in food insecurity from 2020 to 2021, far too many people still struggle with hunger. However, lessons learned from the pandemic prove that social programs work to reduce poverty and food insecurity.
Offering Healthy School Meals for All, P-EBT, and the Child Tax Credit proved to be a lifeline for families. Boosts to Supplemental Nutrition Assistance Program benefits and flexibilities to the Special Supplemental Nutrition Program for Women, Infants, and Children (WIC) have been critical to helping families put healthy food on the table.
Greater investments are needed in these programs. The White House Conference on Hunger, Nutrition, and Health on September 28 presents an important opportunity to build on those lessons and make ending hunger a national priority. Meanwhile, Congress must act quickly as time is running out to pass legislation that will ensure that critical child nutrition and WIC programs are improved, strengthened, and expanded so that all children receive the nutrition they so desperately need.