
March 4, 2022
According to new analysis from the Centers for Disease Control and Prevention (CDC), 10.8 percent of children lived in households that experienced food insecurity during 2019 and 2020. Analyzing the data by different populations revealed deep disparities.
The percentage of children living in households experiencing food insecurity was higher than the national average for Black and Latinx children and children with a disability (Figure 1).
This new analysis reinforces the need for Congress to extend USDA’s child nutrition waiver authority in the next appropriations bill that must pass on March 11.
Figure 1: Percentage of children who lived in households that experienced food insecurity, by race and ethnicity and disability status, United States 2019-2020
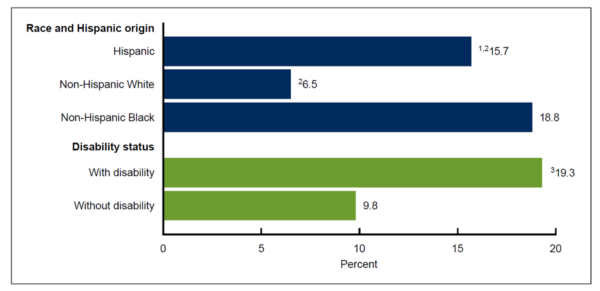
1Significantly different from non-Hispanic White children (p<0.05)
2Significantly different from non-Hispanic Black children (p<0.05)
3Significantly different from children without disability (p<0.05)
NOTES: The disability indicator is only calculated for children aged 2-17 years. Estimates are based on household interviews of a sample of the U.S. civilian noninstitutionalized population. Access data table for Figure 2 at: https://www.cdc.gov/nchs/data/databriefs/db432-tables.pdf#2.
SOURCE: National Center for Health Statistics, National Health Interview Survey, 2019-2020.
In addition, food insecurity rates varied by geographic area and family structure, which was the largest disparity.
- The percentage of children living in households experiencing food insecurity was highest for children in large, central cities (13.2 percent) and in rural areas (12.9 percent) compared to more suburban areas (7.4-10.5 percent).
- The percentage of children living single-parent households that experienced food insecurity (19.9 percent) was about 2.5 times higher than the percentage of children living in households with other family structures that experienced food insecurity (7.7 percent).
These disparities in rates of food insecurity among households with children are the result of structural drivers of inequities, such as structural racism. These structures refer to the ways society historically and currently fosters discrimination and the unjust distribution of resources through mutually reinforcing systems, such as education, jobs, housing, credit, healthcare, and criminal justice system. Understanding how the underlying reasons for these disparities differ by community (e.g., racial/ethnic group, disability status, geographical areas) is critical when implementing policy solutions.
Take Action: Urge Congress to Extend USDA’s Authority to Issue Nationwide Child Nutrition Waivers
The federal nutrition programs are proven to reduce hunger and have been essential supports for families during COVID-19. During the pandemic, Congress took the important step to give USDA the authority to issue nationwide child nutrition waivers to ensure access to meals and to allow the programs to operate safely support program operations. That authority has been critical to mitigating the hunger and economic impact of the pandemic and to supporting program operations, but it is set to expire on June 30, 2022.
The waivers remain needed as the nation recovers from the impact of the pandemic. are needed now as schools plan meals for next school year under severe supply chain constraints and summer food providers plan for the upcoming summer. Click here to weigh in with your Congressional on the need to extend the waivers.
Understanding the Data
It is important to use several different datasets to understand trends in food insecurity rates. The CDC analysis uses data from the National Health Interview Survey (NHIS), which is different than the survey used by USDA to generate their annual estimates of food insecurity rates. Although both surveys measure household food security in the past 30 days and use the same questions, USDA collects their data once a year in December, while CDC collects their data throughout the year.
When similar trends exist across datasets, it gives us more confidence that those patterns are true. Both USDA and CDC data show stark disparities in food security among households with children by race and ethnicity and family structure. Rates are lowest for White households and higher among Black and Latinx households, and highest for single-parent households compared to other family structures. In addition, both surveys show that food insecurity rates are higher in rural and inner-city geographical areas, and lower in suburban areas. The CDC data adds that disparities in food insecurity also exist according to whether a child has a disability.