
Contact:
Emily Pickren
epickren@frac.org
 202-640-1118
WASHINGTON, August 1, 2018 — In every part of the nation, a large number of households is experiencing food hardship — the inability to afford enough food for themselves and their families — according to a new report by the Food Research & Action Center. “How Hungry is America?” reveals that, after several years of decline, the national food hardship rate for all households increased from 15.1 percent in 2016 to 15.7 percent in 2017.
Also see: Food Hardship August 2018 — Interactive Maps and Tables.
The food hardship rate for households with children rose to a considerably higher level, from 17.5 percent in 2016 to 18.4 percent in 2017. Nationally, the food hardship rate for households with children is 1.3 times higher than for households without children.
“While often hidden behind closed doors, food hardship is a serious national problem that requires a serious national response,” said Jim Weill, president, Food Research & Action Center. “Too many people in every region, state, and community have been left behind in the economic recovery from the Great Recession, and are still struggling to put food on the table.”
Although the nation’s unemployment rate continued to fall in 2017, wages were largely stagnant, and Congress and most states failed to provide needed initiatives to boost both wages and public programs for struggling individuals and families. In addition, the Trump Administration and the U.S. House of Representatives have attacked vital programs such as the Supplemental Nutrition Assistance Program (SNAP), school meals, and Medicaid.
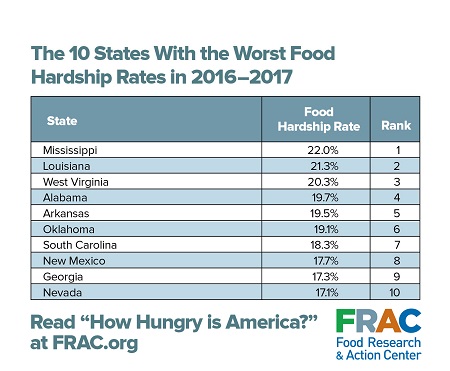
 The Southwest and Southeast regions had the highest food hardship rates in 2017, at 19.3 percent and 17.1 percent, respectively. Of the 10 states with the worst food hardship rates, four were in the Southeast and four were in the Southwest.
Mississippi had the highest food hardship rate among the states, at 22 percent — 1 in 5 households — reporting that they did not have enough money to buy food at some point in the past 12 months. In nearly half the states, 24 plus the District of Columbia, at least 1 in 7 respondent households (14.3 percent or more) reported food hardship. In 63 of 108 Metropolitan Statistical Areas surveyed, at least one in seven households said that affording enough food was a challenge.
“The high rates of food hardship underscore the need for Congress to pass a Farm Bill that protects and strengthens SNAP,” added Weill. “Otherwise, we will see worse health and hunger for struggling children, seniors, working families, and others across the country.”
About the report
How Hungry is America? contains data for the nation for 2017 and for every state and the District of Columbia, and 108 metropolitan statistical areas (MSA) for 2016–2017. The data were gathered as part of the Gallup-Sharecare Well-Being Index project, which has been interviewing hundreds of households daily since January 2008. FRAC analyzed responses to the question: “Have there been times in the past twelve months when you did not have enough money to buy food that you or your family needed?” A “yes” answer to this question is considered to signal that the household experienced food hardship. FRAC uses the phrase “food hardship” to avoid confusion with the annual Census Bureau/U.S. Department of Agriculture survey and analysis that produces “food insecurity” numbers, but the concepts are comparable.
Also see: Food Hardship August 2018 — Interactive Maps and Tables.
###
The Food Research & Action Center is the leading national nonprofit organization working to eradicate poverty-related hunger and undernutrition in the United States.