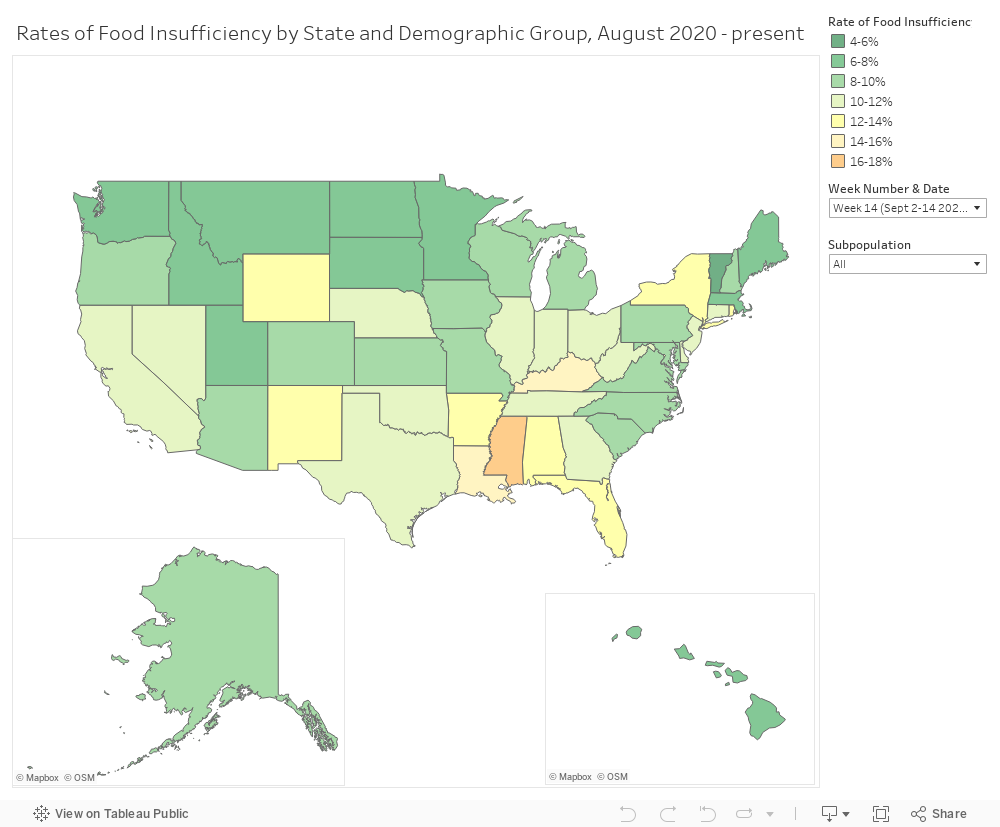
The map below shows the average rate of food insufficiency, which means sometimes or often not having enough to eat, in the previous seven days. Food insufficiency rates are calculated from the Census Household Pulse Survey data.
-
- Select a time period of Pulse data in the drop-down menu. The time period is presented in “weeks” used by the Census Pulse data, which encompasses two calendar weeks. There is a legend that matches each week to the corresponding dates.
- Select a subpopulation in the drop-down menu to see the average state-level food insufficiency rates for that group.
- Hover over a state to see a tooltip, which includes the estimated food insufficiency rate along with the upper limit (UL) and lower limit (LL) of what the food insufficiency estimate could be. See the footnote on the tooltip to learn more about uncertainty in survey data.
- Click on a color in the map legend to highlight only those states with the selected rate of food insufficiency. To return to viewing all states, click inside the map or refresh the page.
Why are some states missing data in the map? While the Census surveys a large and diverse sample, some states have small populations of certain groups. Therefore, a sample for a given state in a two-week survey period might not include enough people to represent a group (for example, Latinx households in South Dakota). These states are not included in the map to reflect that there were insufficient data to calculate a reliable rate of food insufficiency.
What data are included in the tool tip? The tool tip is the box that appears when you hover your mouse over a state. Because the Census is unable to collect data for everyone in each state, food insufficiency data is estimated based on data from a sample. Therefore, the estimate of food insufficiency is based on the data from those individuals who completed the survey in each two-week cycle. Individuals are weighted to represent their state’s population. Because the data come from a sample, each estimate also has a degree of uncertainty. The estimate might have been different had a different group of respondents filled out the survey. Therefore, the tool tip also includes the upper and lower limits of the estimate’s 95 percent confidence interval. The 95 percent confidence interval means there is a 95 percent possibility that the true rate of food insufficiency for the state lies between the upper and lower limits of the confidence interval.
What does “2+ or Other” race mean? Not enough respondents identify as multiracial, American Indian or Alaska Native (AIAN), or Native Hawaiian or Pacific Islander (NHPI). Therefore, the Census includes all of these groups in the “Two or More Races or Other” category. For more information on how COVID-19 has affected these communities, please see FRAC’s research briefs on hunger, poverty, and health during COVID-19: Spotlight on American Indian and Alaska Native (AIAN) Communities and Spotlight on Native Hawaiian and Pacific Islander Communities.