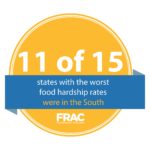
 An infographic, based on FRAC’s analysis of Gallup-Healthways survey data (conducted in 2014 and 2015), with text stating, “11 of 15 states with the worst food hardship rates were in the South.”
Report
City Playbook: Preparing for the Impacts of H.R. 1 on Food Security and Local Economies
