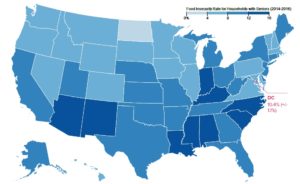
 This interactive map provides food insecurity rates among households with seniors age 60+, by state, on average over 2014-2016. Also includes an interactive, searchable table of senior household food insecurity rates by state.
Best Practice
Advocate’s Checklist: Helping Transition-Age Youth Keep Their SNAP Benefits
