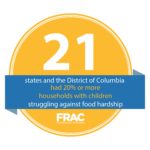
 An infographic, based on FRAC’s analysis of Gallup-Healthways survey data (conducted in 2014 and 2015), with text stating, “21 states and the District of Columbia had 20% or more households with children struggling against food hardship.”
Report
City Playbook: Preparing for the Impacts of H.R. 1 on Food Security and Local Economies
