This interactive map provides household food insecurity rates,
by state, on average over 2019-2021.
Scroll over a state to view the percent of households
struggling with food insecurity or very low food security.
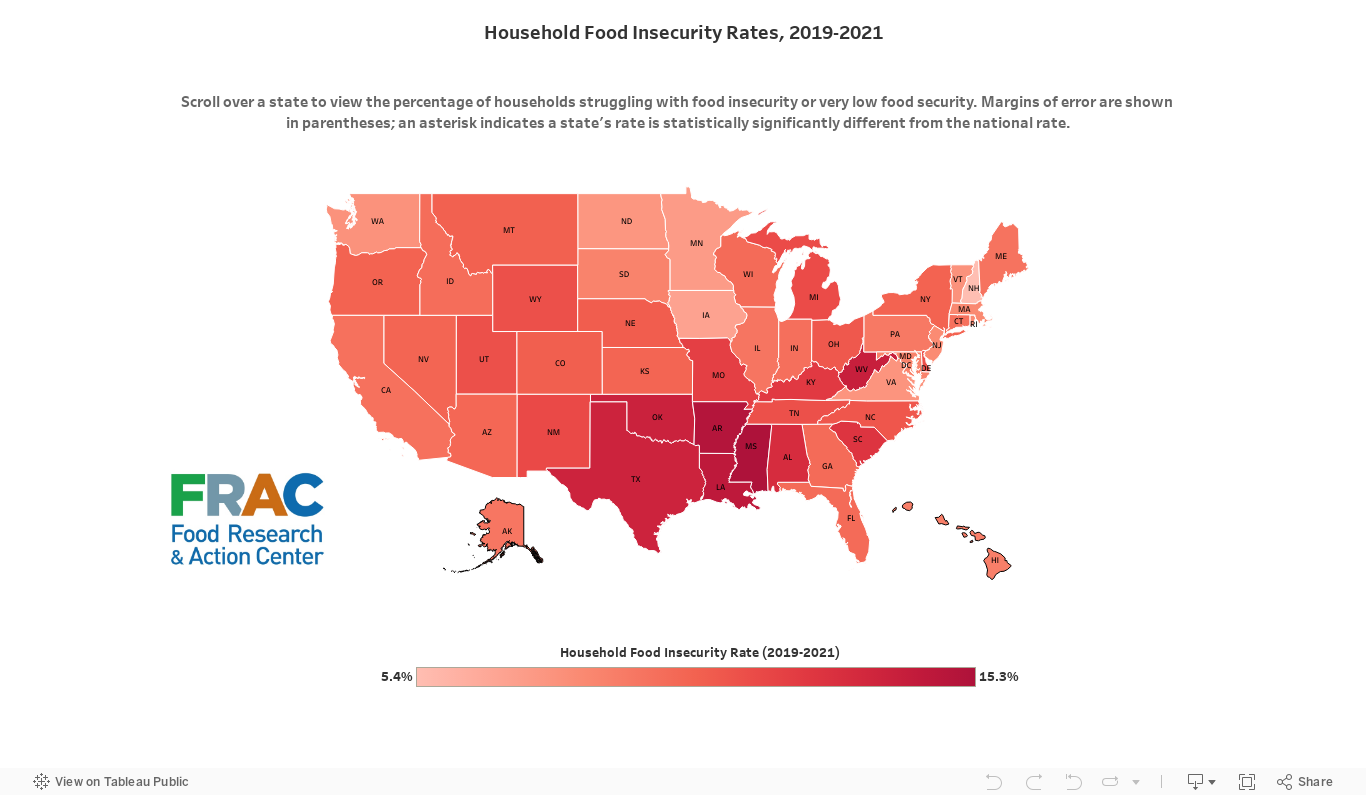
Margins of error are shown in parentheses; an asterisk indicates a state’s rate is
statistically significantly different from the national rate.
- Source
Source: Alisha Coleman-Jensen, Matthew P. Rabbitt, Christian A. Gregory, and Anita Singh. 2022. Household Food Security in the United States in 2021, ERR-309, U.S. Department of Agriculture, Economic Research Service.
- Definitions
- Food insecurity = low food security + very low food security
- Low food security → Reports of reduced quality, variety, or desirability of diet with little or no indication of reduced food intake.
- Very low food security → Reports of multiple indications of disrupted eating patterns and reduced food intake.
Household Food Insecurity Rates by State, 2019–2021
| State | Total No of Households | Food Insecurity Percent of Households | Food Insecurity Statistically Significant Difference from the U.S. Rate | Very Low Food Security Percent of Households | Very Low Food Security Statistically Significant Difference from U.S. Rate |
|---|---|---|---|---|---|
| US | 130708000 | 10.40% | 4.0% | ||
| Alaska | 269000 | 9.50% | 4.0% | ||
| Alabama | 2039000 | 13.10% | * | 4.6% | |
| Arkansas | 1289000 | 15% | * | 6.3% | * |
| Arizona | 2929000 | 10.10% | 3.1% | ||
| California | 14165000 | 9.60% | * | 3.5% | * |
| Colorado | 2345000 | 10.50% | 3.8% | ||
| Connecticut | 1441000 | 9.60% | 4.2% | ||
| District of Columbia | 342000 | 9% | * | 2.8% | * |
| Delaware | 387000 | 11.20% | 4.1% | ||
| Florida | 9274000 | 9.90% | 3.8% | ||
| Georgia | 4179000 | 9.90% | 3.9% | ||
| Hawaii | 487000 | 9.10% | 3.1% | ||
| Iowa | 1316000 | 7% | * | 2.3% | * |
| Idaho | 695000 | 9.80% | 3.9% | ||
| Illinois | 5015000 | 9.40% | 4.0% | ||
| Indiana | 2757000 | 9.70% | 4.5% | ||
| Kansas | 1157000 | 10.20% | 4.2% | ||
| Kentucky | 1867000 | 12.30% | * | 4.4% | |
| Louisiana | 1880000 | 14.50% | * | 5.7% | |
| Massachusetts | 2812000 | 8.40% | * | 3.2% | |
| Maryland | 2301000 | 8.70% | * | 2.9% | * |
| Maine | 571000 | 9.50% | 4.5% | ||
| Michigan | 4142000 | 11.40% | 4.6% | ||
| Minnesota | 2303000 | 7.40% | * | 2.8% | * |
| Missouri | 2503000 | 12% | 5.6% | * | |
| Mississippi | 1174000 | 15.30% | * | 5.5% | * |
| Montana | 474000 | 10.40% | 4.7% | ||
| North Carolina | 4450000 | 10.90% | 3.6% | ||
| North Dakota | 331000 | 7.70% | * | 1.8% | * |
| Nebraska | 792000 | 10.60% | 4.6% | ||
| New Hampshire | 554000 | 5.40% | * | 2.0% | * |
| New Jersey | 3426000 | 8.30% | * | 2.7% | * |
| New Mexico | 865000 | 11.50% | 4.5% | ||
| Nevada | 1220000 | 10.20% | 4.2% | ||
| New York | 7774000 | 10.30% | 3.5% | ||
| Ohio | 4816000 | 10.80% | 4.6% | ||
| Oklahoma | 1591000 | 13.80% | * | 4.4% | |
| Oregon | 1761000 | 10.30% | 3.9% | ||
| Pennsylvania | 5063000 | 9.20% | * | 3.8% | |
| Rhode Island | 430000 | 8.40% | * | 2.6% | * |
| South Carolina | 2180000 | 12.60% | * | 5.9% | * |
| South Dakota | 367000 | 8.70% | * | 3.7% | |
| Tennessee | 2826000 | 11.20% | 4.5% | ||
| Texas | 10766000 | 13.70% | * | 5.0% | * |
| Utah | 1139000 | 11.20% | 3.9% | ||
| Virginia | 3412000 | 7.80% | * | 3.1% | * |
| Vermont | 279000 | 7.90% | * | 2.8% | * |
| Washington | 3096000 | 7.90% | * | 3.0% | * |
| Wisconsin | 2483000 | 9.90% | 3.1% | ||
| West Virginia | 740000 | 14% | 5.2% | * | |
| Wyoming | 233000 | 11.20% | 4.7% |